Digibee · 2024
Monitor: root cause analysis
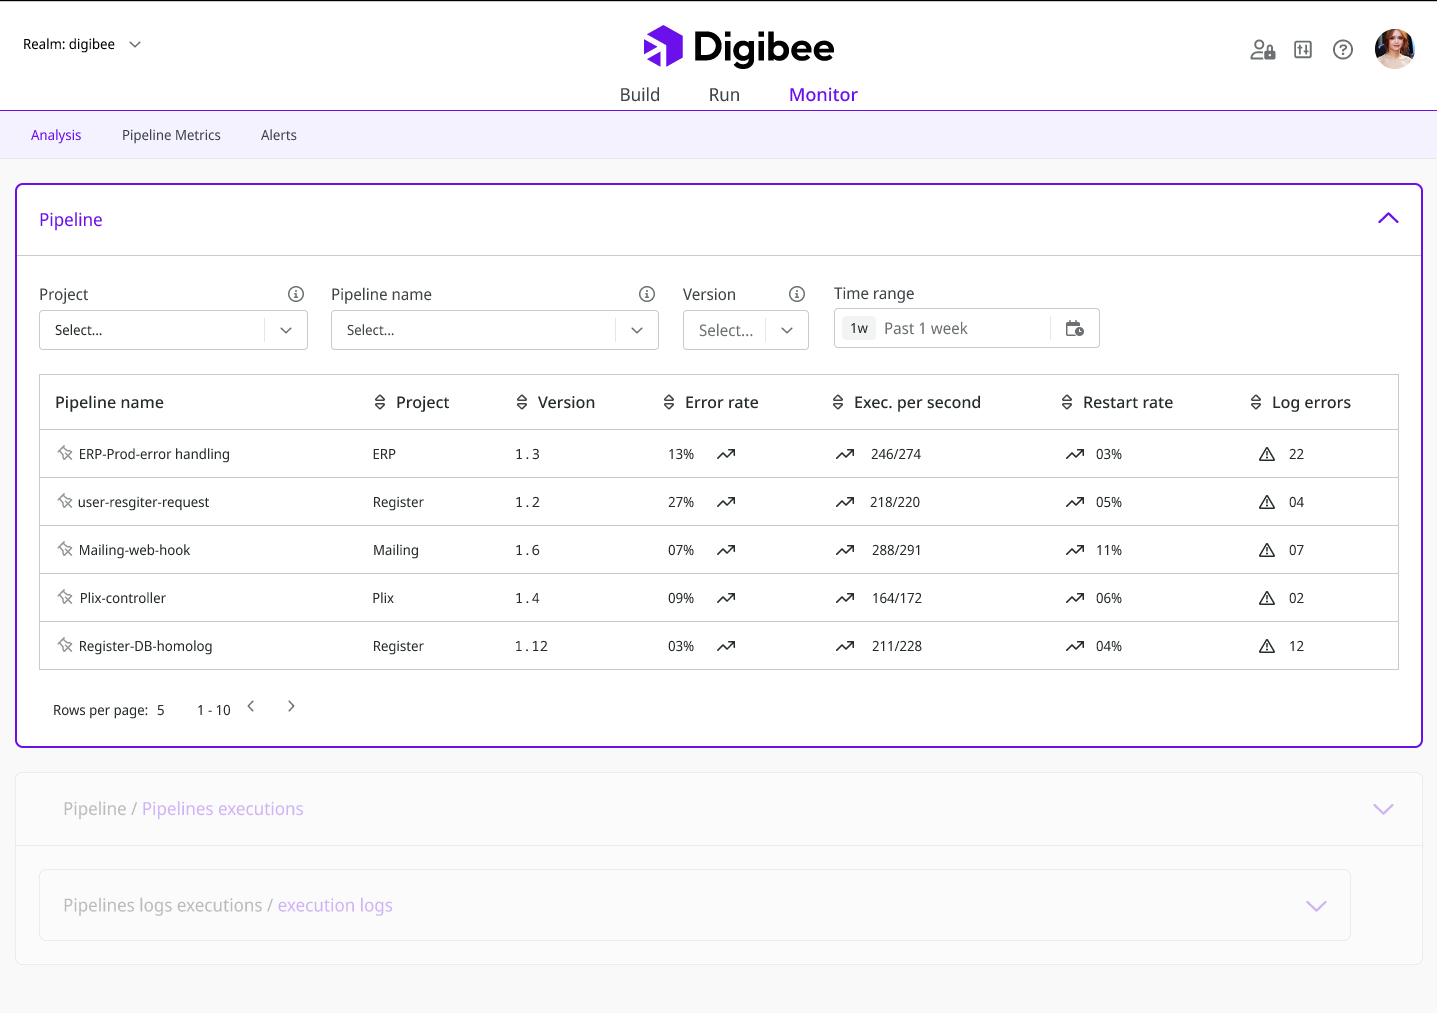
Condensing pipeline, executions and logs into a single troubleshooting flow so users can isolate the error instead of hunting across browser tabs.
- Role
- Discovery, competitive analysis, UX design, usability testing
- Company
- Digibee — iPaaS · Integration platform
- Focus
- Discovery, Observability, Enterprise UX
Monitor is a powerful tool, but it was originally built by software engineers and the experience of using it was never really considered.
It went through several tweaks to improve usability and performance, yet despite plenty of feedback about usability issues we only recently managed to “sell” the need to work on its overall experience. The project started as “Monitor experience redesign”, but that name didn't reflect what we were actually doing — so it became “Root cause analysis”.
Phase 1 — Discovery
We started with stakeholders, to get an overview of Digibee's current moment and understand how to align the initiative with company strategy. Everything was then documented in Marvin so we could build the insights needed to set a direction.
Below is a short clip of the stakeholder who helped us most — Matt Durhan. He opened our eyes to the concept of layers and how we could centralise the analysis in a single place. In other words: could we surface the exact point where the error occurred and start the study from there?
Phase 2 — Exploration
The second phase began with an extensive competitive analysis, which we then condensed into something more tangible.
- 01Provide data autonomy around logs.
- 02Isolate the error — root cause analysis.
- 03Provide a clear path to resolution.
- 04Keep time spent inside Monitor as short as possible.
Research presentation
When research changed the direction
The research surfaced a strategic disagreement between our team and the stakeholders. They wanted to prioritise observability and greater data autonomy, while the evidence pointed to a more immediate need: improving the troubleshooting experience users already relied on. It was not an ideal flow, but it worked — and the research showed exactly where it was failing people.
Rather than treating the discussion as a matter of opinion, I brought the findings back to the group and connected recurring user pain points to the cost and value of each direction. That evidence helped us align with the stakeholders around troubleshooting as the strongest next step: strengthen the existing path first, then build toward broader observability and data autonomy from a more reliable foundation.
Decision backed by evidence
The direction was validated in practice: the redesigned troubleshooting flow became about 40% more efficient.
Phase 3 — Validation and testing
We first tested the observability proposal, but it proved too expensive in time and development effort, so we took a more conservative route: root cause analysis became the MVP and observability was pushed to a later phase.
Figma
Result
Troubleshooting time reduced in 41% and support tickets reduced by nearly 20%.